| January | February | March | April | May | June | July | August | September | October | November | December | Annual Total mm | |
| 2017 | 23.2 | 6.2 | 1.2 | 45.8 | 18.4 | 2 | 7.2 | 32.8 | 3.8 | 10.6 | 32.8 | 39 | 223 |
| 2018 | 7.6 | 3.2 | 1.6 | 2.8 | 12 | 24.4 | 9 | 24.8 | 2.8 |
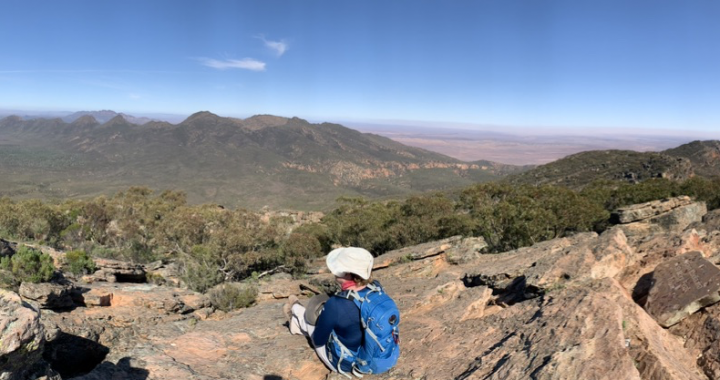
While sitting, I was thinking about rain. Back at our Calperum site in the Mallee near Renmark, 2018 rain up to June was only 27.2 mm compared to 96.8 mm for the same period in 2017. The median annual total for Calperum is 241 mm from 21 years. There is a rough pattern of above average rainfall about every 5 years, with 354.4 and 299 mm in 2000 and 2001; 264.8 mm in 2005; 419.8 and 457.4 mm in 2010 and 2011; 392 mm in 2016.
We had a whopping 147.8 mm on the 28th September 2016. These large variations in rainfall are only generally represented in the annual statistics and it is often the large variations in the monthly rainfall amounts that illustrate the episodic nature of this environment – prolonged dry periods interspersed with quite high rainfall events. Its clear that the mallee trees have successfully evolved to survive and at times thrive in this environment.


